
The price recovery swing did not trigger any buying, a sure sign that there were traps that were avoided. Can you avoid them all?
By Fabio Pioli, professional trader, creator of Miraclapp, the largest extra income platform
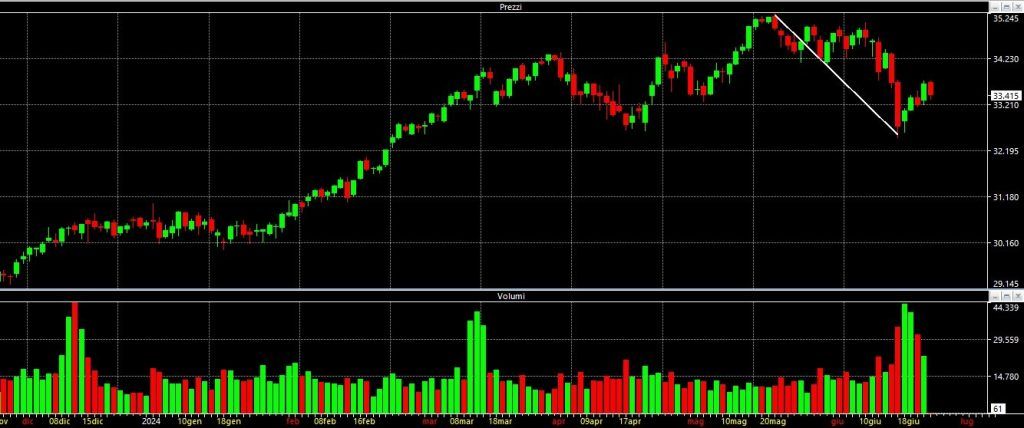
After the decline that occurred between May 20, 2024 and June 14 (Figure 1)
Fig 1. Future FTSEMib – Daily chart
The price of the main stocks on the Italian market has “deflated” and has become more attractive compared to the fictitious previous prices. Here, the banks have lost some 10% and some more, here, Poste Italiane has lost 8.5%, here, Enel has lost about 6%, here, Leonardo has lost 13.4%, etc.
And here the idea of buying pops into the minds of Italians. At least the doubt of whether to buy: “Can I buy?”
But, as we have been saying for some time now (at least six months), this is where the main danger comes in. In fact, we have said and still believe: “the great danger of 2024 will be buying too early”.
Be careful: buying will be the necessary thing to do but buying too soon will be harmful because it will involve the risk of seeing your portfolio deflate like a balloon giving back to the market what it has granted with the addition of interest.
But what does “too soon” mean? We see it right away.
With the rebound that occurred last week (which made people want to buy) we had the first test. Well the trap was not sprung, if it was a trap. In any case, Miraclapp did not buy: no reliable signal for profit was triggered apart from one (which due to the way it is structured still entails a probability of +94.44% of bringing a positive result).
So if the trap hasn’t been sprung, does that mean we’ll get off?
For the truth It means two things:
- or we will go down again (a lot or a little) before going back up
- or there will be real long signals with mathematical reliability that you absolutely must take and not miss.
One of the two.
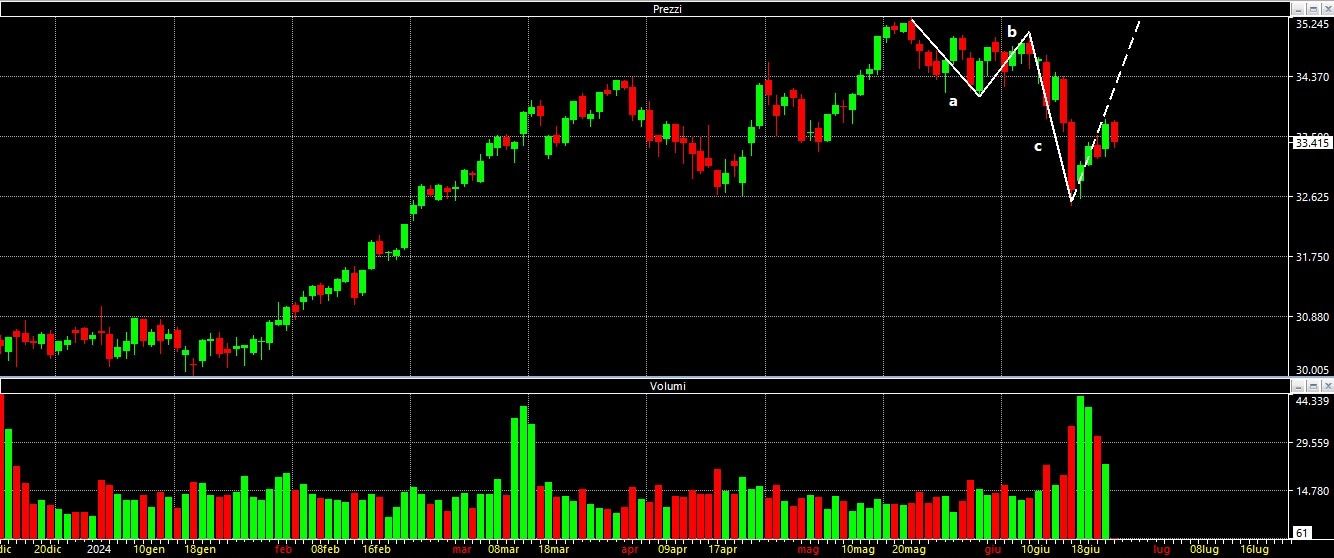
In fact, one of the possible options for the market is this one (Figure 2), which allows for a fall first and then a rise.
Fig 2. FTSEMib Futures – Daily Chart
while another possible option is that of Figure 3 which immediately admits the increase.
Fig 3. FTSEMib Futures – Daily Chart
The first is a bullish trap while the second is a nice bullish opportunity.
