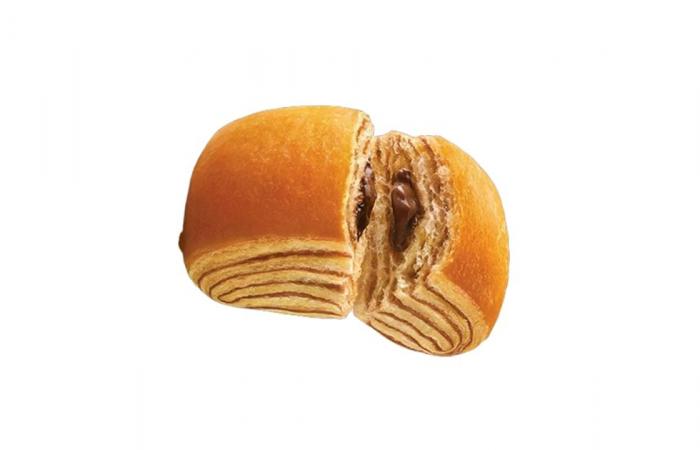
A market that is worth almost 1.5 billion euros and where the share of relevance of the discount and of the MDD it is certainly above average: this is the picture taken from the analysis of the updated data provided by NIQ to GDONews.
Over the past year, turnover has grown by just under 6%, in a rolling year (AT 31 March 24) where the first five months of high inflation were experienced, followed by a decline towards 2% in the first three months of 2024. Although inflation is no longer very high, it is still significant.
In this article we will go into the merits of the GDO sales divided by Nielsen Area updated to AT 31 March 2024checking the trends of revenues in each territory, of volumes (both in kg and in pieces sold), we will evaluate the inflationary impact of the last moving year in the four areas and we will check the different trends of promotional pressure.
In the following articles we will analyze the more specific aspects such as Total Italy Omnichannel sales, the evolution of the individual segments, the trend of the different sales formats and finally the evolution of the MDD in all its aspects.
ARTICLE RESERVED FOR PREMIUM AND PROFESSIONAL SUBSCRIBERS
By analyzing the performance in the four main areas of the country, we can understand how this turnover is distributed. Southern Italy records the highest turnover with snacks, totaling 455 million euros and a growth of 6%. Area 1 (northwest) follows with 381 million euros and a growth of 6.5%. Surprisingly, area 4, usually the least performing in terms of total turnover, recorded a record in sales, becoming the first territory for snack consumption.
Area 1, although not recording high per capita consumption like southern Italy, sees significant sales of snacks (381 million euros) thanks to the wide range of products and the presence of numerous large supermarkets that facilitate sales. Area 3 behaves differently compared to area 2, which instead confirms itself as the last in terms of snack sales. Despite this, area 2 (north-east) recorded the best percentage growth, with an increase of 7%.
Market shares see area 4 as leader with 32.1%, followed by area 1 with 26.9%, area 3 with 22.2% and area 2 with 18.8%. Sales in volume reflect the trends already observed for value, with a more marked decline in volumes in area 3 (central Italy) compared to the other territories. There are no major differences in market shares in value, as the behavior in volume is similar.
As for packages, there was a loss of 2.7% of pieces sold in area 3, while area 2 did not show significant negative variations in sales per package. The average price per kilo is higher in the north, with an increase of 8.1% in area 1 and 8.3% in area 2, less sustained in central Italy and the south. The average price per package is also higher in the north than in the south of the country.
Finally, promotional pressure is very high in area 4 (27.9%), followed by area 1 with 25.2%.


